Appearance
Module: Co-occurrence Heatmap
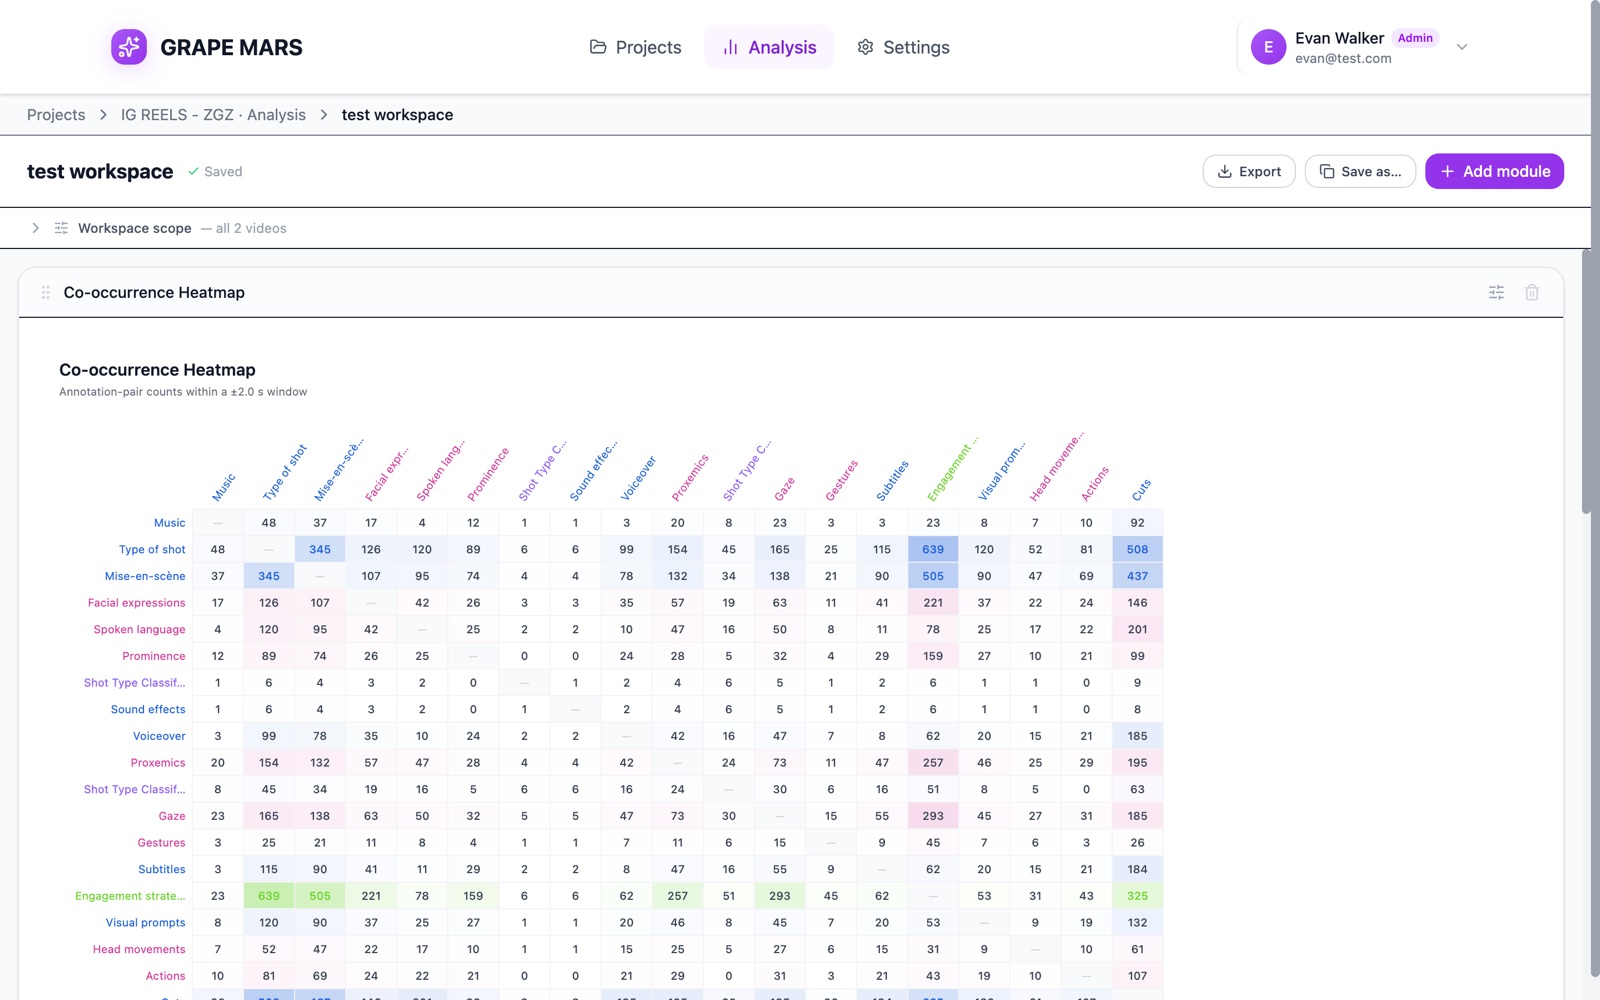
Add a grid that counts how often each pair of annotation types happens together within a time window.
Before you start
Steps
- Click Add module. The drawer opens on the right.
- Click + next to Co-occurrence Heatmap. The module lands at the foot of the page.
- Click the settings button in its title bar. A panel opens with the slider Co-occurrence window.
- Drag the slider to the window you want. The grid redraws at once.
Check it worked
The card says how wide the window is, such as "Annotation-pair counts within a ±2.0 s window". A darker square means a higher count.
The window starts at 2000 ms. You can set it from 500 ms to 10000 ms, in steps of 500 ms.
Two marks count as a pair when their time ranges touch after GRAPE MARS stretches each one by the window on both sides. A window of 2 seconds therefore joins marks that nearly touch, as well as marks that truly overlap.
The grid needs at least 2 types in scope. With fewer, the card says so instead.
The Excel sheet holds the same square grid, with the type names down the side and across the top.